Diagram / Infographic
Reasoning Context and Prompt Cache Slide
Goal: Create a clean 16:9 Japanese business/technical infographic slide about how continuous reasoning context and explicit prompt caching improve long-running task efficiency. Use a polished PowerPoint-native infographic look with dense but readable explanatory text.
Fields you can change: headline text, lead text, conclusion text.
Full prompt
Goal: Create a clean 16:9 Japanese business/technical infographic slide about how continuous reasoning context and explicit prompt caching improve long-running task efficiency. Use a polished PowerPoint-native infographic look with dense but readable explanatory text.
Canvas: 16:9 landscape slide, warm off-white background, dark navy text, teal and olive green accent colors, thin rounded borders, subtle shadows, generous margins. Leave no photo-realistic elements; use flat vector icons and crisp typography.
Top text area: Place a large bold Japanese headline at the top left: {argument name="headline text" default="継続推論と明示的キャッシュが長期タスクを効率化"}. Under it, add a smaller semibold lead sentence: {argument name="lead text" default="過去ターンの推論と再利用可能なプロンプトを選択的に保持することで一貫性と効率を高められるが、前提変更や利用回数を踏まえて保存範囲を設計する必要がある。"}
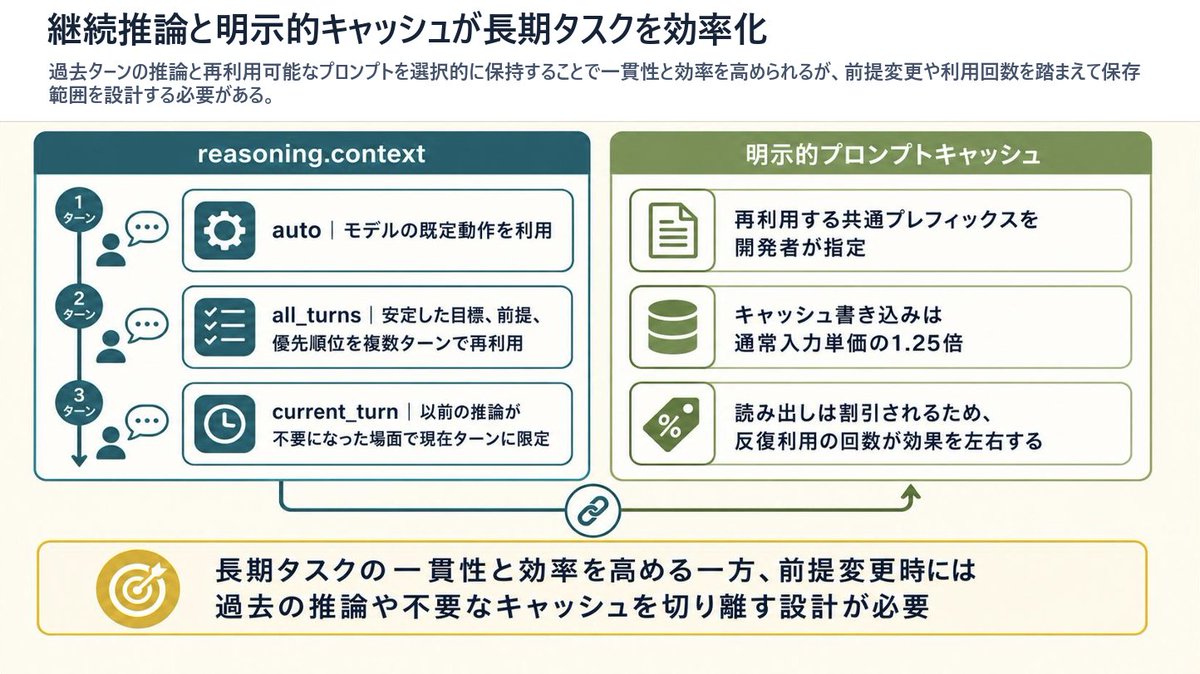
Main layout: Two large rounded rectangular panels sit side by side beneath the lead sentence. The left panel is teal and titled “reasoning.context”; the right panel is olive green and titled “明示的プロンプトキャッシュ”. Connect the panels with a thin line and a small circular chain-link icon centered between them near the bottom, suggesting coordination between reasoning context and cache. A small upward green arrow near the right panel points back toward it.
Left panel details: Include exactly 3 vertically stacked turn markers on the far left, connected by a vertical line with a downward arrow. The markers are labeled “1ターン”, “2ターン”, and “3ターン”. Next to each marker, show a small person icon and speech bubble. To the right, include exactly 3 horizontal rounded cards with teal icon blocks and Japanese explanatory text: 1) gear icon, “auto|モデルの既定動作を利用”; 2) checklist icon, “all_turns|安定した目標、前提、優先順位を複数ターンで再利用”; 3) clock icon, “current_turn|以前の推論が不要になった場面で現在ターンに限定”.
Right panel details: Include exactly 3 horizontal rounded cards with olive icon blocks and Japanese explanatory text: 1) document icon, “再利用する共通プレフィックスを開発者が指定”; 2) database cylinder icon, “キャッシュ書き込みは通常入力単価の1.25倍”; 3) percent tag icon, “読み出しは割引されるため、反復利用の回数が効果を左右する”.
Bottom conclusion band: Across the bottom, create one wide rounded rectangle callout with a thin yellow border. On the left of the band place a gold target icon with an arrow. To the right, place a bold Japanese conclusion: {argument name="conclusion text" default="長期タスクの一貫性と効率を高める一方、前提変更時には過去の推論や不要なキャッシュを切り離す設計が必要"}.
Visual style: Japanese corporate slide design, crisp vector line icons, rounded rectangles, light cream background, teal left section, olive right section, yellow conclusion accent, strong hierarchy, highly legible Japanese sans-serif typography, no decorative clutter.
Constraints: Preserve the exact count of elements: 2 main panels, 3 left turn markers, 3 left option cards, 3 right cache cards, 1 central chain-link connector, 1 bottom conclusion callout, and 1 target icon. Do not add extra panels, extra cards, watermarks, logos, or decorative characters. Keep all slide text inside the infographic sharp and readable.