Diagram / Infographic
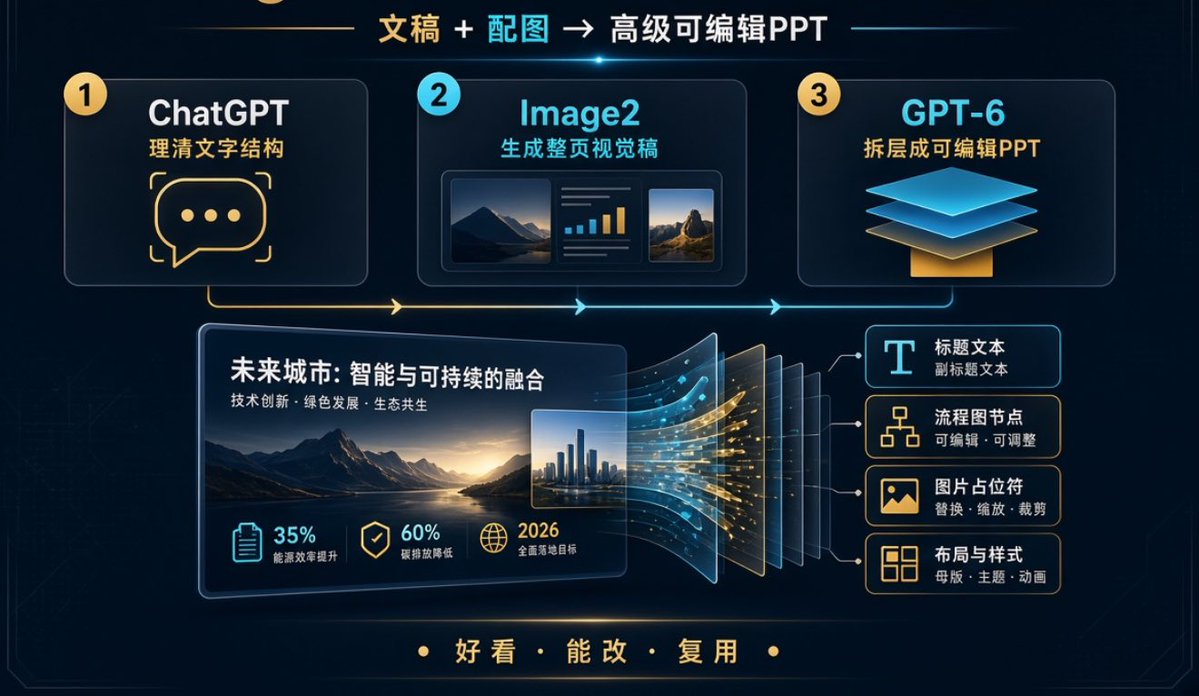
Editable PPT Workflow Infographic
Goal: Create a dark futuristic Chinese workflow infographic slide showing how to turn written content plus images into an advanced editable PPT, with a premium tech presentation aesthetic.
Fields you can change: headline text, demo slide title, demo slide subtitle, bottom slogan.
Full prompt
Goal: Create a dark futuristic Chinese workflow infographic slide showing how to turn written content plus images into an advanced editable PPT, with a premium tech presentation aesthetic.
Canvas: Wide 16:9 horizontal slide, deep navy/black background with subtle circuit-line texture, thin glowing border, cyan and gold neon accents, soft bloom highlights, clean corporate SaaS style.
Main headline: Centered at the top, use {argument name="headline text" default="文稿 + 配图 → 高级可编辑PPT"}. Highlight “文稿” in gold, “配图” in cyan, and the rest in white. Add a small cyan lens flare under the headline.
Top workflow layout: Place exactly 3 large rounded rectangular cards across the upper half, connected by a glowing horizontal process line and arrows that run left to right.
1. Card 1: Yellow numbered circle “1”, title “ChatGPT”, subtitle “理清文字结构”, large gold chat-bubble icon with three dots.
2. Card 2: Cyan numbered circle “2”, title “Image2”, subtitle “生成整页视觉稿”, small mock visual preview containing exactly 3 inner panels: a landscape image, a mini bar-chart/text panel, and a second landscape image.
3. Card 3: Yellow numbered circle “3”, title “GPT-6”, subtitle “拆层成可编辑PPT”, layered floating blue sheets over a gold base icon.
Central demonstration: In the lower middle-left, create one large tilted PPT slide mockup with rounded corners and glow. Slide title text: {argument name="demo slide title" default="未来城市:智能与可持续的融合"}. Slide subtitle: {argument name="demo slide subtitle" default="技术创新 · 绿色发展 · 生态共生"}. Inside the slide, show a cinematic mountain lake landscape at sunset, plus a small inset city skyline image on the right.
Metric row inside the slide: Show exactly 3 metric items along the bottom of the slide: “35% 能源效率提升” with a clipboard icon in cyan, “60% 碳排放降低” with a shield/check icon in gold, and “2026 全面落地目标” with a globe icon in gold.
Layer conversion effect: To the right of the central slide, show the slide splitting into multiple translucent editable layers, about 7 visible stacked panels, with flowing cyan and gold data particles moving from the slide into the layers.
Editable output list: On the right side, create exactly 4 stacked rounded cards connected by thin lines to the separated layers:
1. “标题文本” with smaller text “副标题文本”, icon: large letter T.
2. “流程图节点” with smaller text “可编辑 · 可调整”, icon: flowchart nodes.
3. “图片占位符” with smaller text “替换 · 缩放 · 裁剪”, icon: image placeholder.
4. “布局与样式” with smaller text “母版 · 主题 · 动画”, icon: layout grid.
Bottom slogan: Centered near the bottom, in gold Chinese characters with dot separators, use {argument name="bottom slogan" default="好看 · 能改 · 复用"}.
Visual style: High-resolution presentation infographic, crisp vector-like UI, luminous cyan and warm gold strokes, glassmorphism cards, subtle depth and perspective, modern Chinese typography, clean spacing, no people, no logos, no watermark. Keep all listed text legible and preserve the exact counts: 3 top workflow cards, 3 metric items, 4 editable-output cards, and 7 visible separated layer panels.