Diagram / Infographic
Japanese BI Strategy Slide
Goal: Create a polished Japanese corporate strategy slide about the purpose and future vision of a project using accumulated data from an insurance-safety network and BI tools.
Fields you can change: project data source, analysis tool, slide title, overall message, bottom message.
Full prompt
Goal: Create a polished Japanese corporate strategy slide about the purpose and future vision of a project using accumulated data from an insurance-safety network and BI tools.
Canvas: 16:9 horizontal presentation slide, white background, navy and light-blue corporate palette, thin blue outlines, clean grid alignment, dense but readable Japanese business-slide typography.
Title: Large navy heading at top left: 「1.1. 本事業の目的と将来像」.
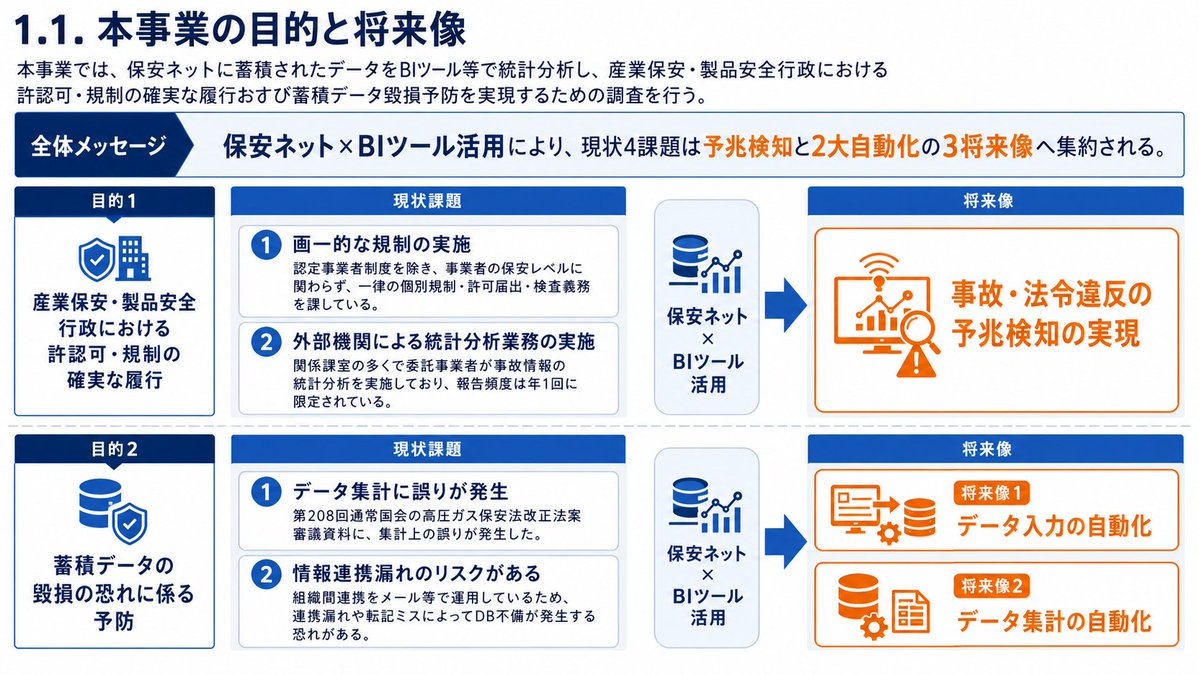
Top overview box: Directly under the title, add a white rectangular box with a thin navy border. On the left, include a dark navy pill label 「概要」. To the right, write: 「本事業では、保安ネットに蓄積されたデータをBIツール等で統計分析し、産業保安・製品安全行政における許認可・規制の確実な履行および蓄積データ毀損予防を実現するための調査を行う。」
Overall message band: Below the overview, add a pale blue horizontal band. On the left, a dark-blue arrow label 「全体メッセージ」. Main message text in bold navy: 「保安ネット×BIツール活用により、現状4課題は予兆検知と2大自動化の3将来像へ集約される。」
Main layout: Three columns with headings from left to right: 「目的」, 「現状課題」, 「将来像」. Use two horizontal rows separated by a dotted divider. Use arrows from current issues toward future vision cards.
Left column, exactly 2 dark navy purpose cards:
1. Card label 「目的1」 in a small white rounded pill, main text: 「産業保安・製品安全行政における許認可・規制の確実な履行」.
2. Card label 「目的2」 in a small white rounded pill, main text: 「蓄積データの毀損の恐れに係る予防」.
Center column, exactly 4 current issue items grouped into two pale-gray rounded containers, each item with a navy circular number badge:
1. 「画一的な規制の実施」 with smaller explanation 「認定事業者制度を除き、事業者の保安レベルに関わらず、一律の個別規制・許可届出・検査義務を課している。」
2. 「外部機関による統計分析業務の実施」 with smaller explanation 「関係課室の多くで委託事業者が事故情報の統計分析を実施しており、報告頻度は年1回に限定されている。」
3. 「データ集計に誤りが発生」 with smaller explanation 「第208回通常国会の高圧ガス保安法改正法案審議資料に、集計上の誤りが発生した。」
4. 「情報連携漏れのリスクがある」 with smaller explanation 「組織間連携をメール等で運用しているため、連携漏れや転記ミスによってDB不備が発生する恐れがある。」
Right column, exactly 3 future vision cards with blue outline and simple line icons:
1. Top large card connected from the first issue group by a thick navy arrow, icon of a magnifying glass with rising bar chart and warning triangle, text: 「事故・法令違反の予兆検知の実現」.
2. Middle card connected from the second issue group by a branching arrow, icon of a computer monitor/document with upload or transfer arrows, text: 「データ入力の自動化」.
3. Bottom card connected by the same branching arrow, icon of a database cylinder with gear, text: 「データ集計の自動化」.
Bottom message strip: Full-width white strip with thin blue border. On the left, a circular target icon. Text in bold navy: 「保安ネットの蓄積データをBIツールで可視化・分析することで、規制運用の高度化とデータ品質向上を同時に実現」.
Visual style: Japanese consulting deck aesthetic, crisp vector icons, consistent navy #003b8f / deep blue #001f5b accents, pale blue highlight bands, rounded cards, subtle gray dividers, no photos, no shadows beyond very light card depth. Keep all text sharp and legible, with the exact count of 2 purpose cards, 4 issue items, and 3 future vision cards. Use {argument name="project data source" default="保安ネット"}, {argument name="analysis tool" default="BIツール"}, {argument name="slide title" default="1.1. 本事業の目的と将来像"}, {argument name="overall message" default="保安ネット×BIツール活用により、現状4課題は予兆検知と2大自動化の3将来像へ集約される。"}, and {argument name="bottom message" default="保安ネットの蓄積データをBIツールで可視化・分析することで、規制運用の高度化とデータ品質向上を同時に実現"}.