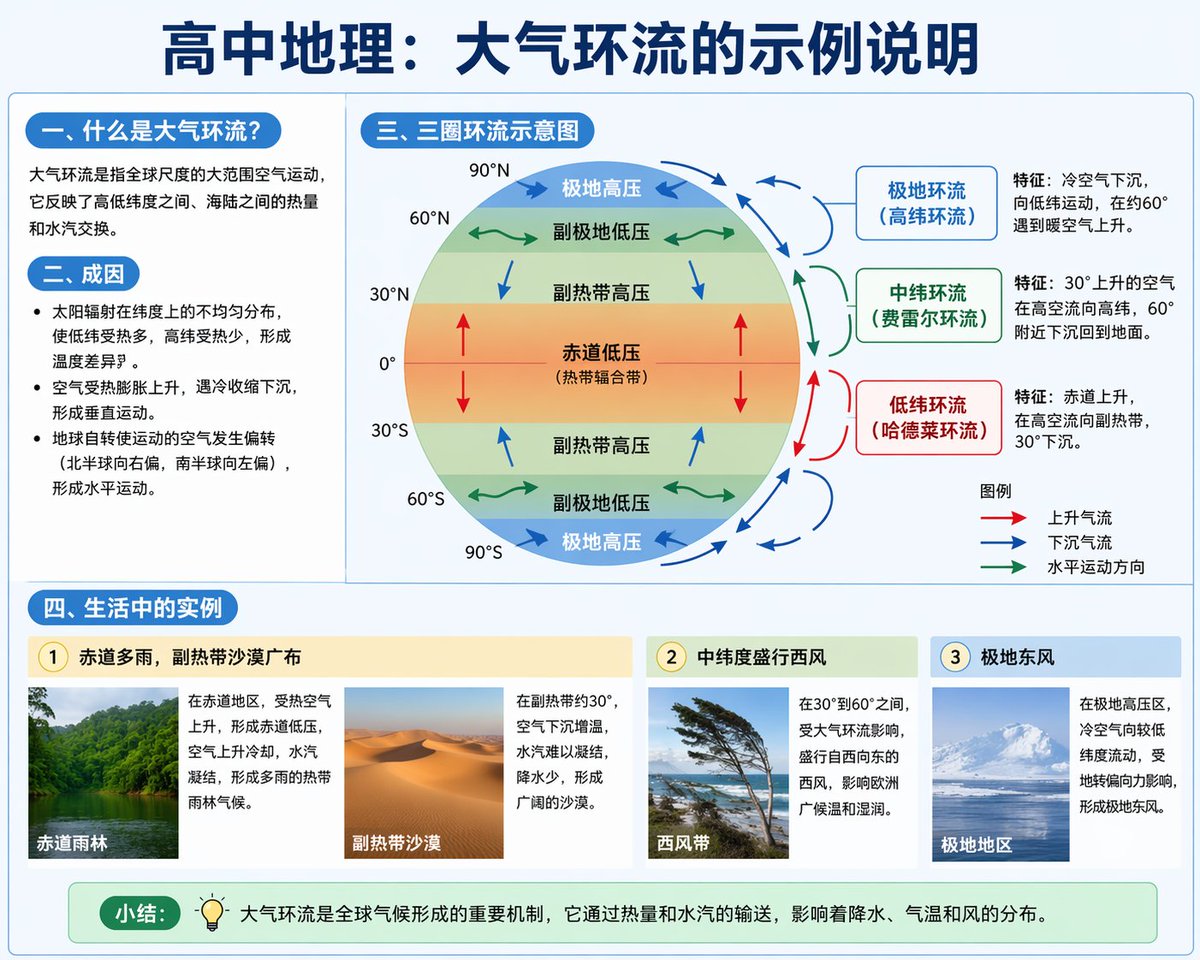
Educational Infographic on Atmospheric Circulation
一、什么是大气环流?. 二、成因. 三、三圈环流示意图. 3 text boxes detailing characteristics of each cell. 四、生活中的实例. 1 赤道多雨,副热带沙漠广布. 2 中纬度盛行西风. 3 极地东风. educational infographic. clean, modern textbook illustration, light blue and white color palette. 高中地理:大气环流的示例说明.
Fields you can change: main title, section one title, diagram title, examples title, footer label.
Full prompt
{
"type": "educational infographic",
"style": "clean, modern textbook illustration, light blue and white color palette",
"header": "{argument name=\"main title\" default=\"高中地理:大气环流的示例说明\"}",
"layout": {
"top_left_column": {
"section_1": {
"title": "{argument name=\"section one title\" default=\"一、什么是大气环流?\"}",
"content": "1 short explanatory paragraph about global air movement"
},
"section_2": {
"title": "二、成因",
"content": "3 bullet points explaining solar radiation, vertical movement, and Coriolis effect"
}
},
"top_right_column": {
"section_3": {
"title": "{argument name=\"diagram title\" default=\"三、三圈环流示意图\"}",
"diagram_features": [
"Earth cross-section showing latitudes 0 to 90 degrees North and South",
"Color-coded pressure belts: red (equator), yellow (subtropics), green (subpolar), blue (polar)",
"Arrows indicating air flow directions"
],
"circulation_cells": {
"count": 3,
"labels": ["极地环流 (高纬环流)", "中纬环流 (费雷尔环流)", "低纬环流 (哈德莱环流)"],
"descriptions": "3 text boxes detailing characteristics of each cell"
},
"legend": {
"title": "图例",
"items": "3 arrow types: red (ascending), blue (descending), green (horizontal)"
}
}
},
"bottom_row": {
"section_4": {
"title": "{argument name=\"examples title\" default=\"四、生活中的实例\"}",
"examples": {
"count": 3,
"items": [
{
"subtitle": "1 赤道多雨,副热带沙漠广布",
"images": "2 photos: tropical rainforest and desert",
"text": "2 text blocks explaining the climates"
},
{
"subtitle": "2 中纬度盛行西风",
"images": "1 photo: windswept trees on a coast",
"text": "1 text block explaining westerlies"
},
{
"subtitle": "3 极地东风",
"images": "1 photo: snowy mountains",
"text": "1 text block explaining polar easterlies"
}
]
}
}
},
"footer": {
"label": "{argument name=\"footer label\" default=\"小结:\"}",
"icon": "lightbulb",
"content": "1 summary sentence about global climate mechanisms"
}
}
}
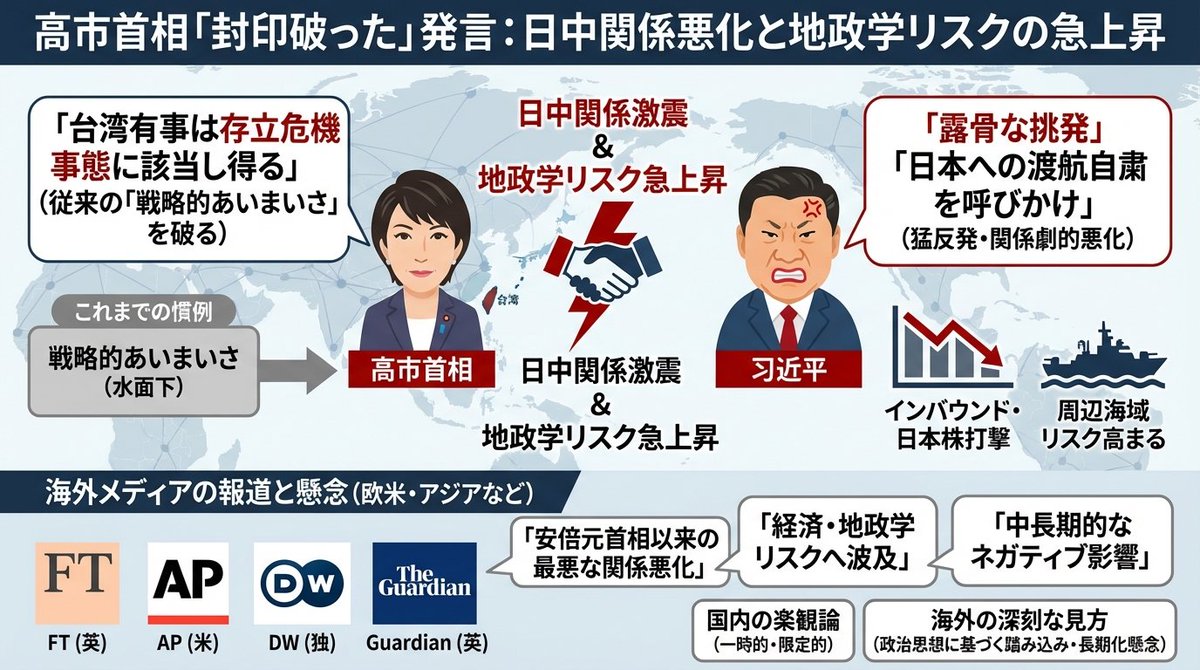
Completely reproduce the attached image as a single slide in a pptx file.
Make the text fully editable, and crop and use the diagrams and graphs from the original image as they are.
Generate an image that clearly summarizes the following {argument name="news_source_en" default="Yahoo News"} article in a single slide, using diagrams and illustrations.
---
{argument name="news_body_en" default="{paste the Yahoo News article here}"}
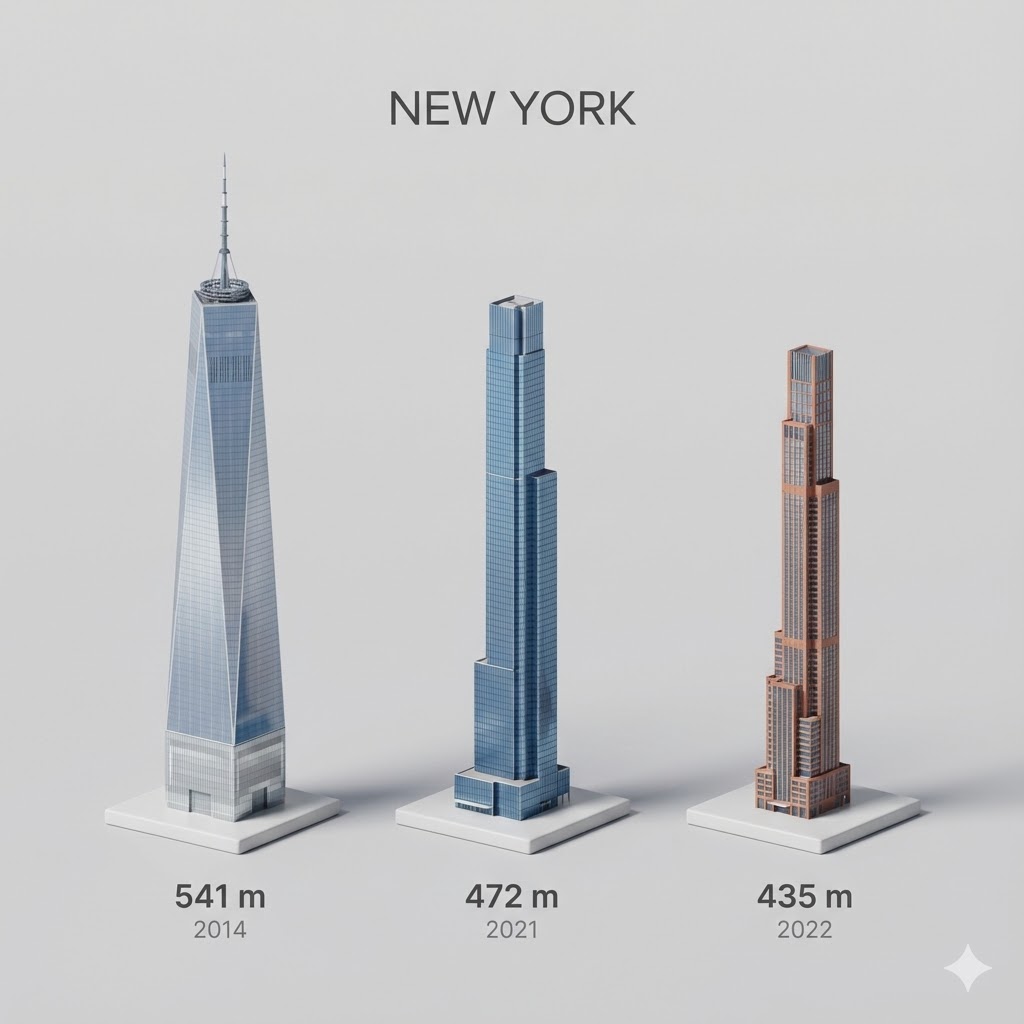
Present a clear, side miniature 3D cartoon view of the tallest buildings in {argument name="city in English" default="YOUR CITY"}. Use minimal textures with realistic materials and soft, lifelike lighting and shadows. Use a clean, minimalistic composition showing exactly the three tallest buildings in {argument name="reference city in English" default="Sopot"}, arranged from left to right in strict descending height order. The tallest must appear visibly tallest, the second must be clearly shorter than the first, and the third must be clearly shorter than the second.
All buildings must follow accurate relative proportions: if a building is taller in real life, it must be taller in the image by the same approximate ratio. No building may be visually stretched or compressed.
Each building should stand separately on a thin, simple ceramic base. Below each base, centered text should display:
Height in meters — semibold sans-serif, medium size
Year built — lighter-weight sans-serif, smaller size, directly beneath the height text
Provide consistent padding, spacing, leading, and kerning. Write “{argument name="city name title" default="YOUR CITY NAME"}” centered above the buildings, using a medium-sized sans-serif font.
No building top should overlap or touch the text above. Use accurate architectural proportions based on real-world references. Maintain a consistent camera angle and identical scale for each building model.
No forced perspective. Use straight-on orthographic-style rendering. Do not exaggerate or stylize size differences beyond proportional accuracy.
Use a square 1080×1080 composition. Use a clean, neutral background. Ensure no extra objects are present.
I want an illustrated diagram explaining the roles of dopamine and D2 receptors in the synaptic cleft between neurons, and how they relate to schizophrenia. Antipsychotic drugs exert their effects by blocking D2 receptors. Please diagram this for the three cases: healthy person | hallucination and delusion state | under antipsychotic medication. Generate a horizontally oriented image.